AI Adoption by Country in 2026: What a Weekly Map of 190 Countries Shows
The UAE leads, the US ranks 24th, and money is growing far faster than the number of people using AI. Seven findings from the AI Adoption Atlas, and what they mean for small and mid-size businesses.
Data: the AI Adoption Atlas, week 43 of 2026, updated 23 October 2026. This article was drafted with AI and checked against the linked sources before publishing.
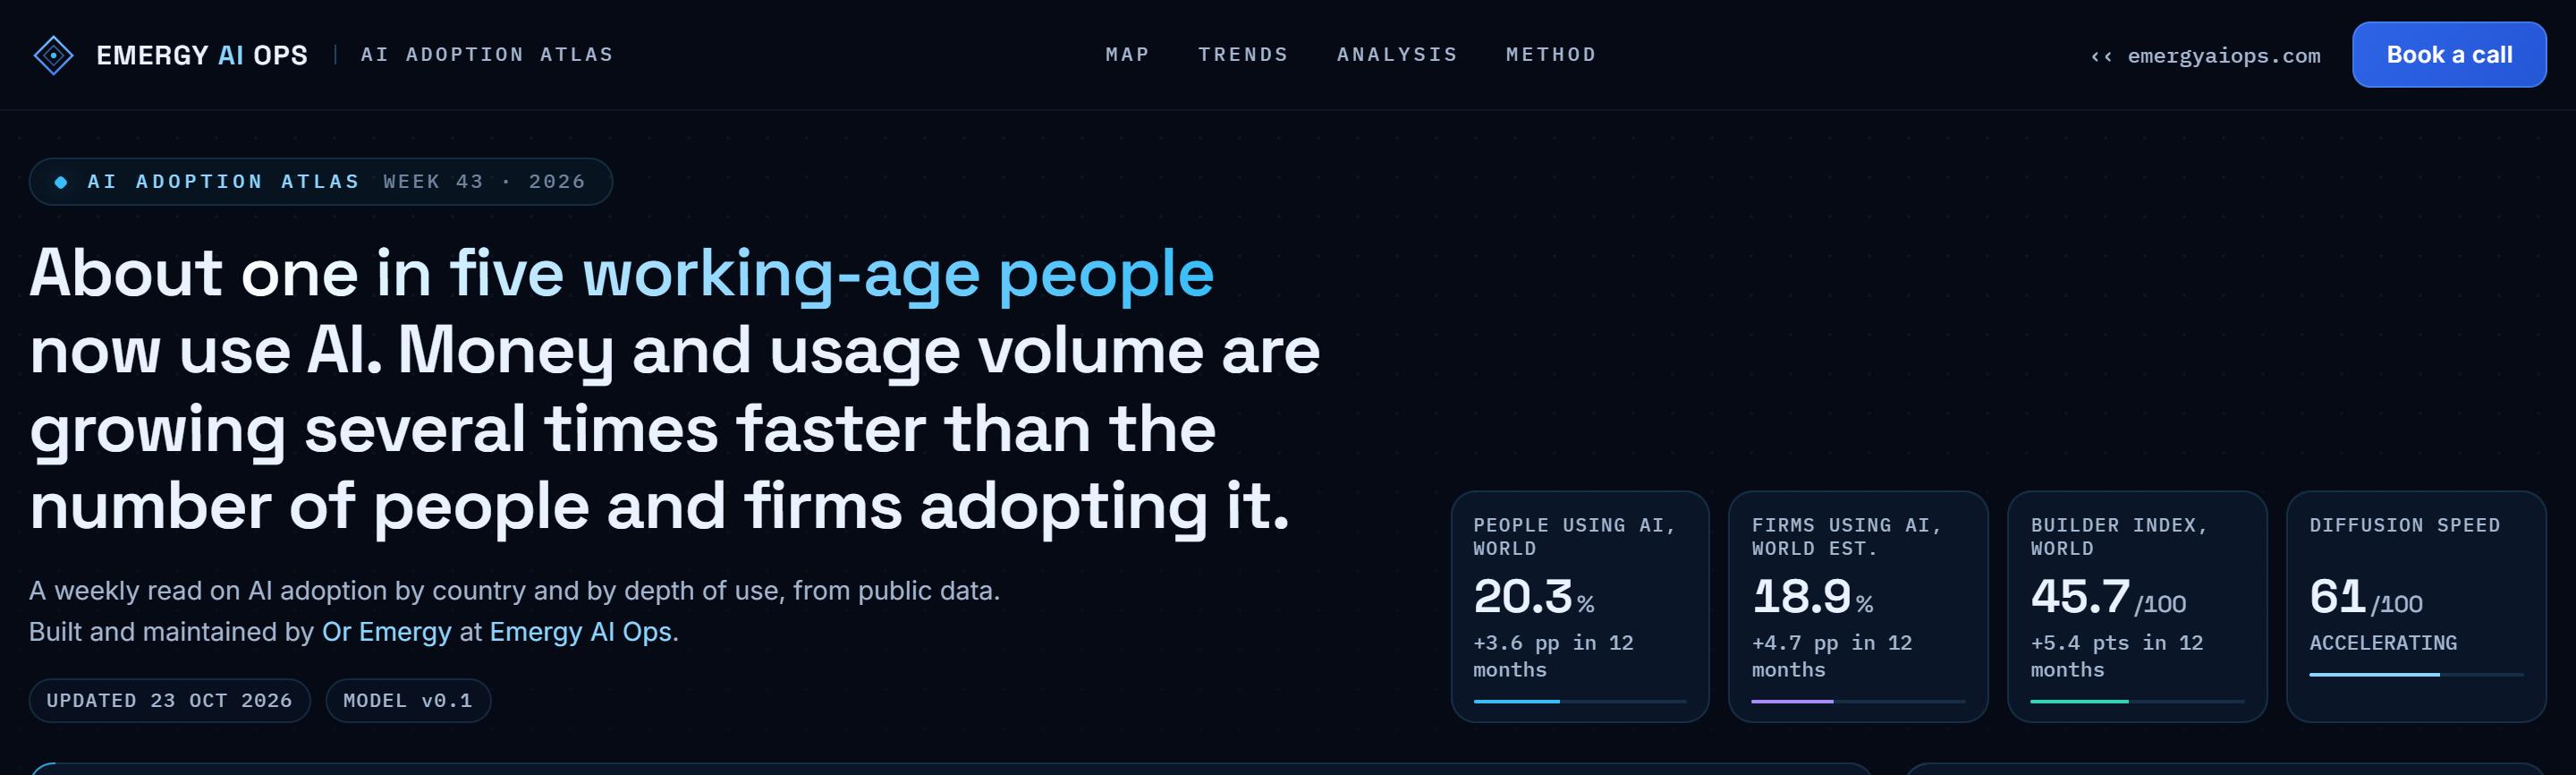
About one in five working-age people in the world now use AI tools. That average hides a map with large gaps: between countries, between levels of use, and between the money going into AI and the people actually using it.
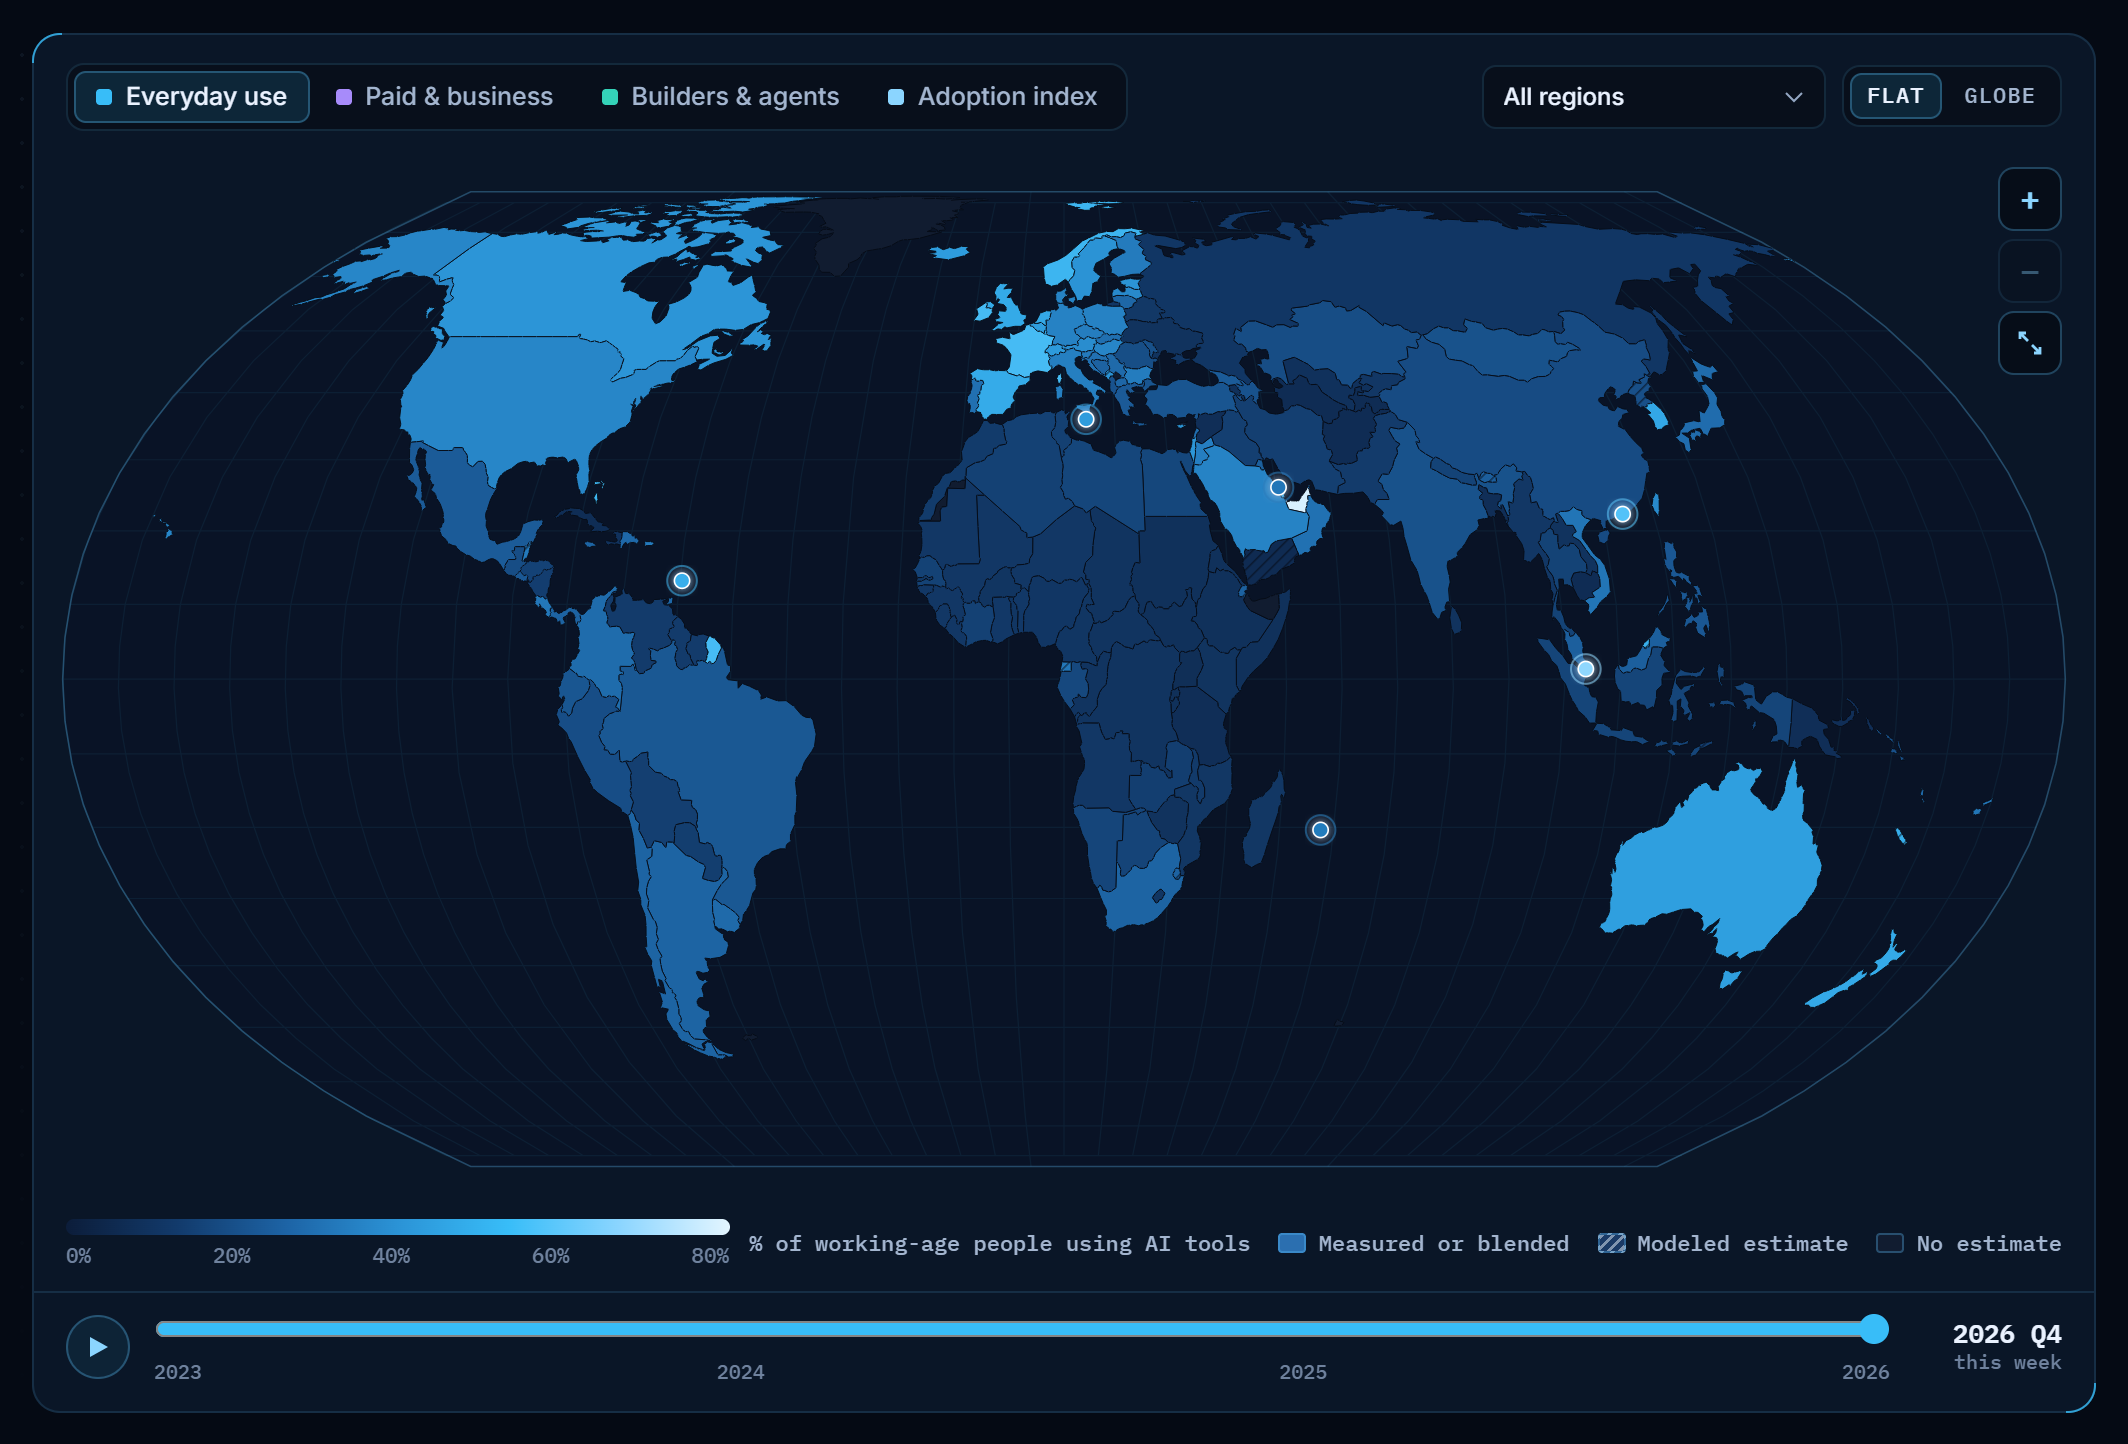
To see those gaps every week, we built the AI Adoption Atlas, a free interactive map of about 190 countries at three levels of use. Everyday use of tools like ChatGPT, Gemini, Copilot and Claude. Business use, measured as the share of firms using AI. And a builder index for the people building with AI: developers, agents and automation. It updates every Saturday night from official statistics, company figures and developer data.
The short version
- About 20% of working-age people worldwide use AI tools. Microsoft measured 18.8% in Q2 2026, up from 17.8% in Q1.
- The United Arab Emirates leads everyday use at about 79%. The United States ranks 24th, at about 36%.
- Business use has its own leaders: Denmark, South Korea and Finland. Israel ranks 8th.
- Builders cluster where developers are dense: Hong Kong, Singapore, Estonia and Israel lead the builder index.
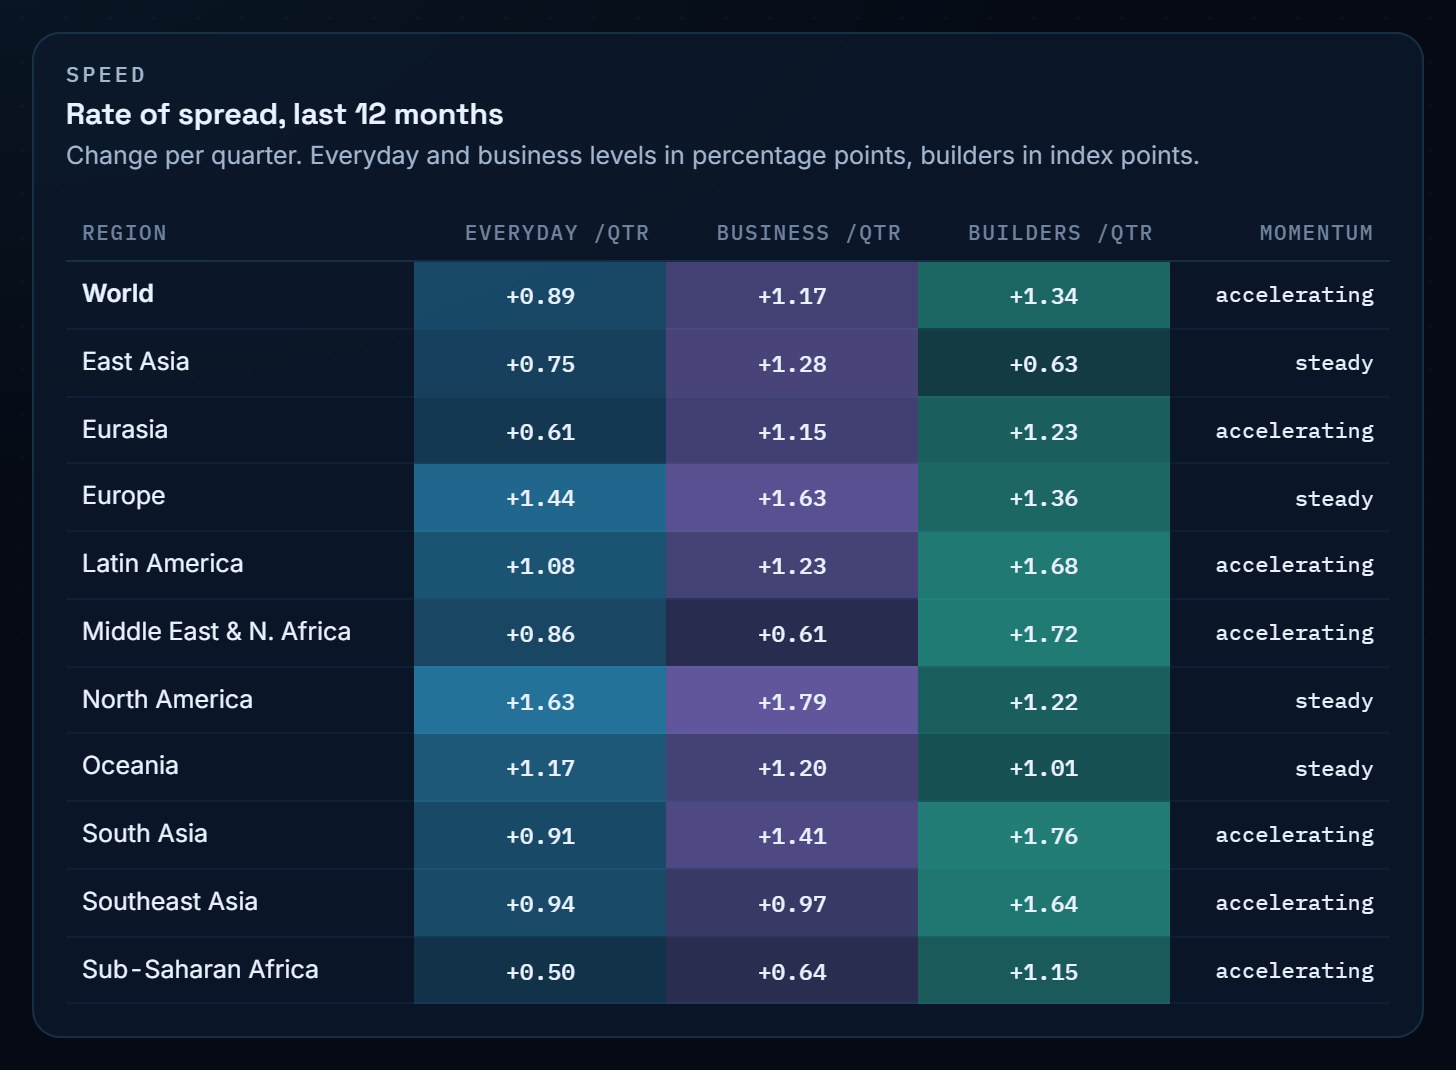
- Europe and North America add 1.4 to 1.6 points of everyday use a quarter. Sub-Saharan Africa adds 0.5.
- Money moves much faster than people: AI venture funding is up 127% in a year, while the share of people using AI rose 3.6 points.
1. One in five people use AI, and the share grows about a point a quarter
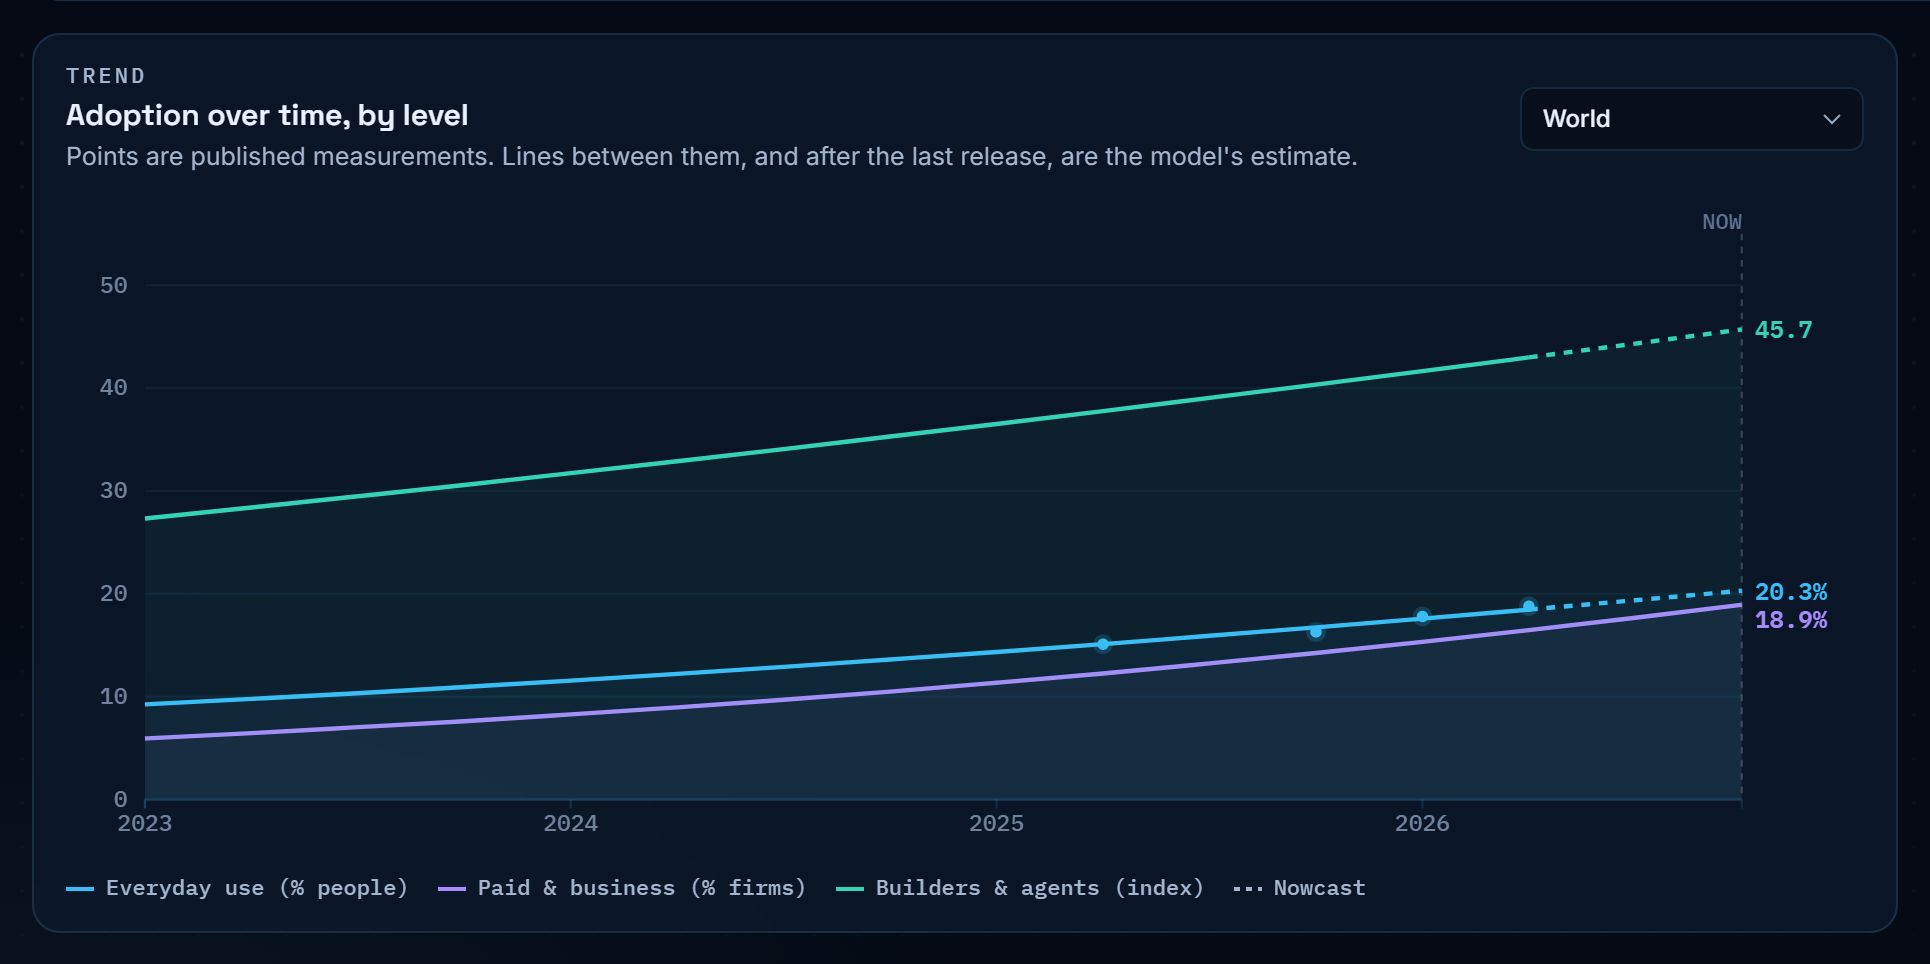
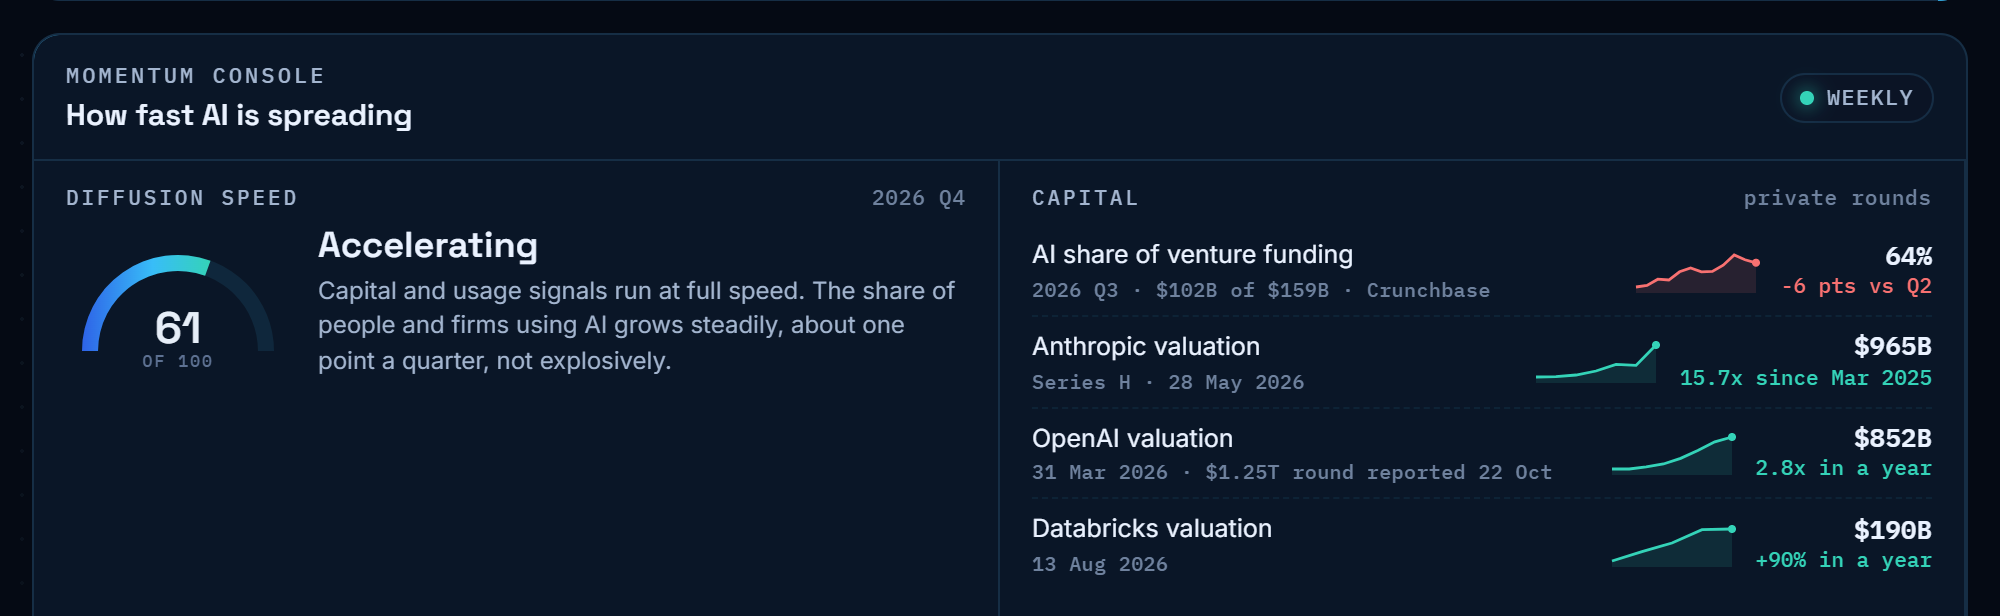
Microsoft's AI Diffusion Report measures the share of people aged 15 to 64 who use generative AI. It rose from 17.8% in the first quarter of 2026 to 18.8% in the second. The atlas nowcast for this quarter is 20.3%, up 3.6 points in twelve months.
The other two levels move at a similar pace. The atlas estimates that about 19% of firms worldwide use AI, growing about 1.2 points a quarter, and the world builder index stands at 45.7 out of 100, up 5.4 points in a year. This is steady, compounding growth: a habit forming across whole populations, one quarter at a time.
2. The UAE leads everyday use. The US ranks 24th.
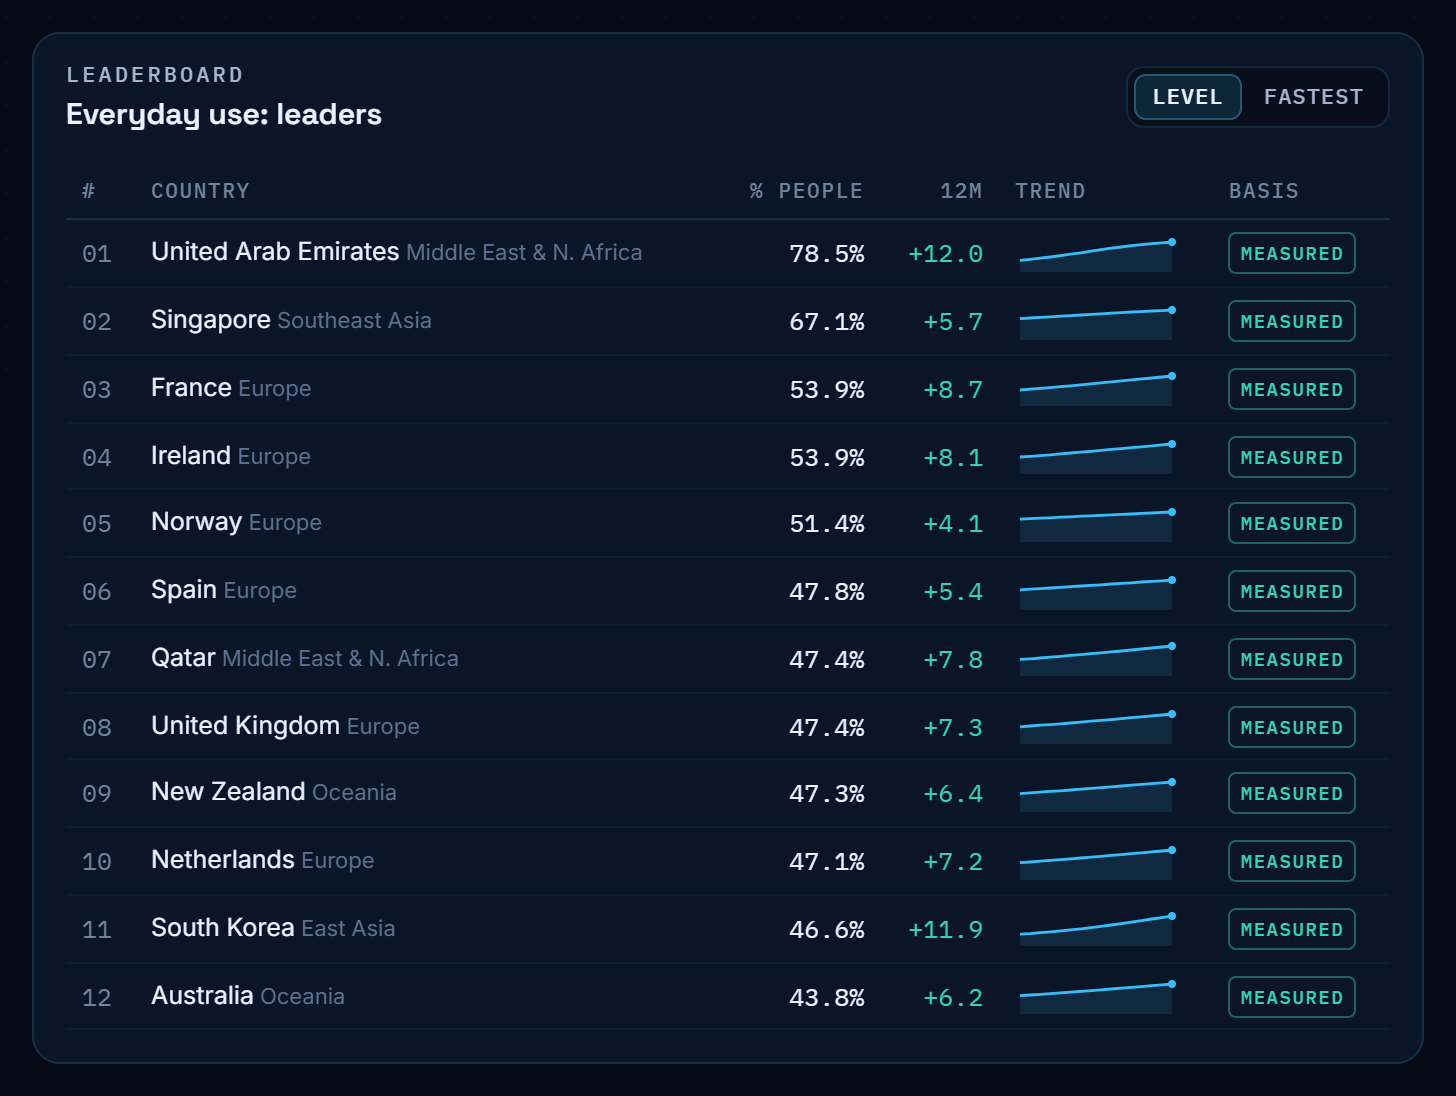
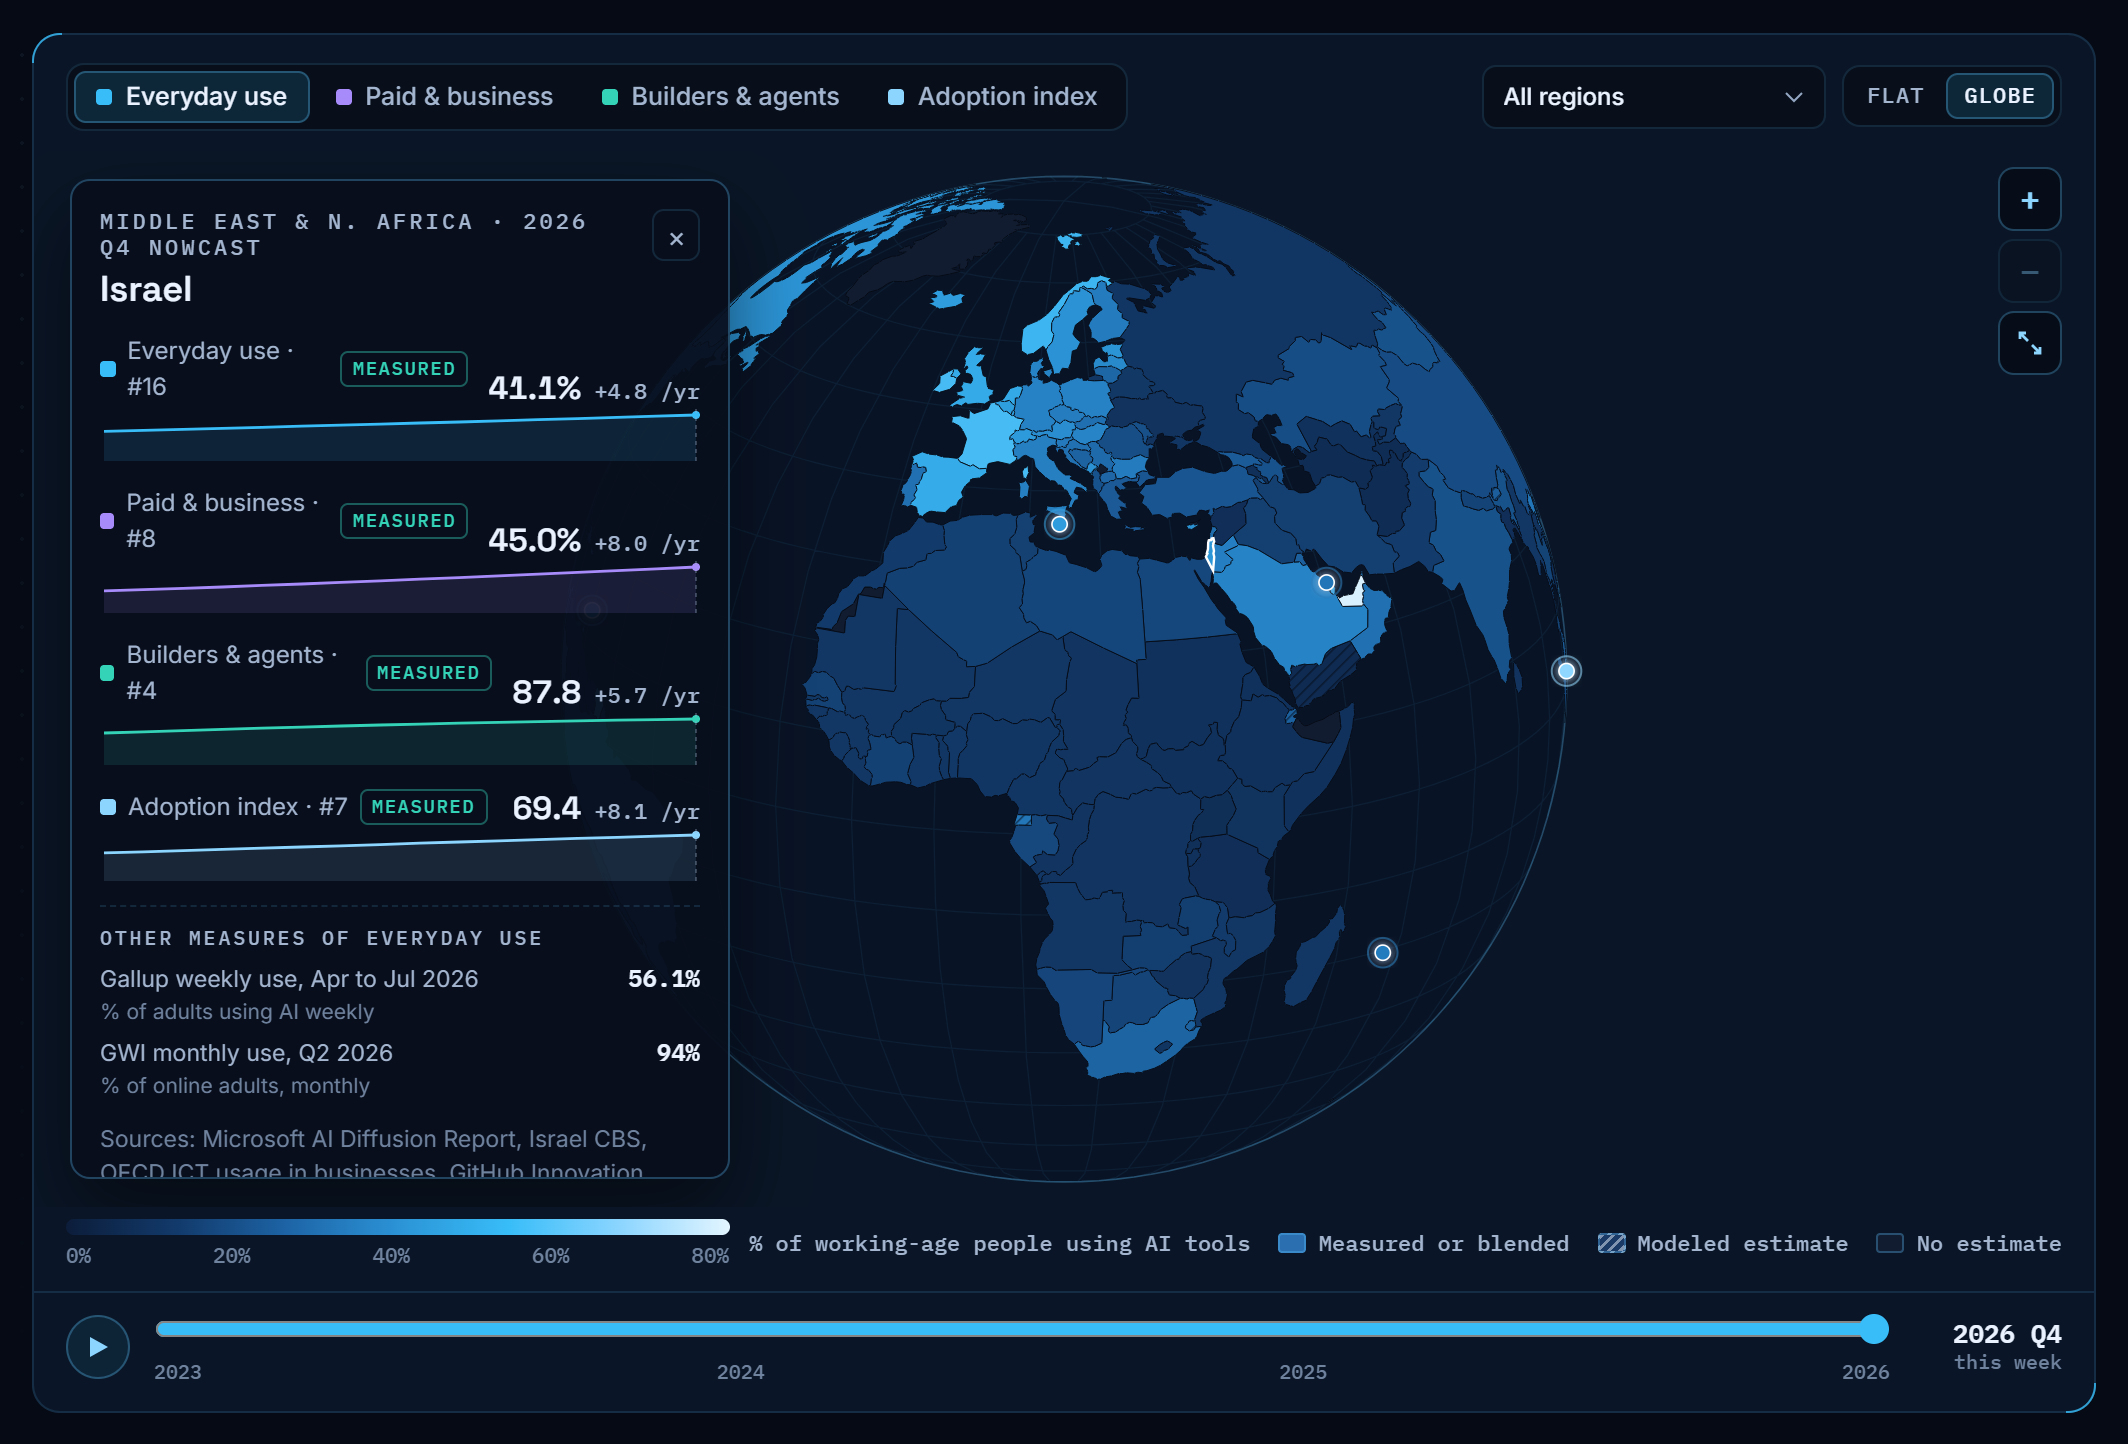
Everyday use is highest in small, wealthy, highly connected countries. The United Arab Emirates leads at about 79% of working-age people (Microsoft measured 73.3% in Q2 2026). Singapore follows at 67%, then France and Ireland at about 54%, Norway at 51%, and Spain, Qatar, the United Kingdom, New Zealand and the Netherlands at 47% to 48%.
The United States sits at 36.4%, 24th in the world. Germany is 28th at 35%, Japan 47th at 29%, Brazil 69th at 23% and India 75th at 21%. The US picture changes on the deeper levels: it ranks 12th on the builder index. A large country can lead in building AI and still trail in how many ordinary people use it.
3. The fastest climbers: the UAE and South Korea
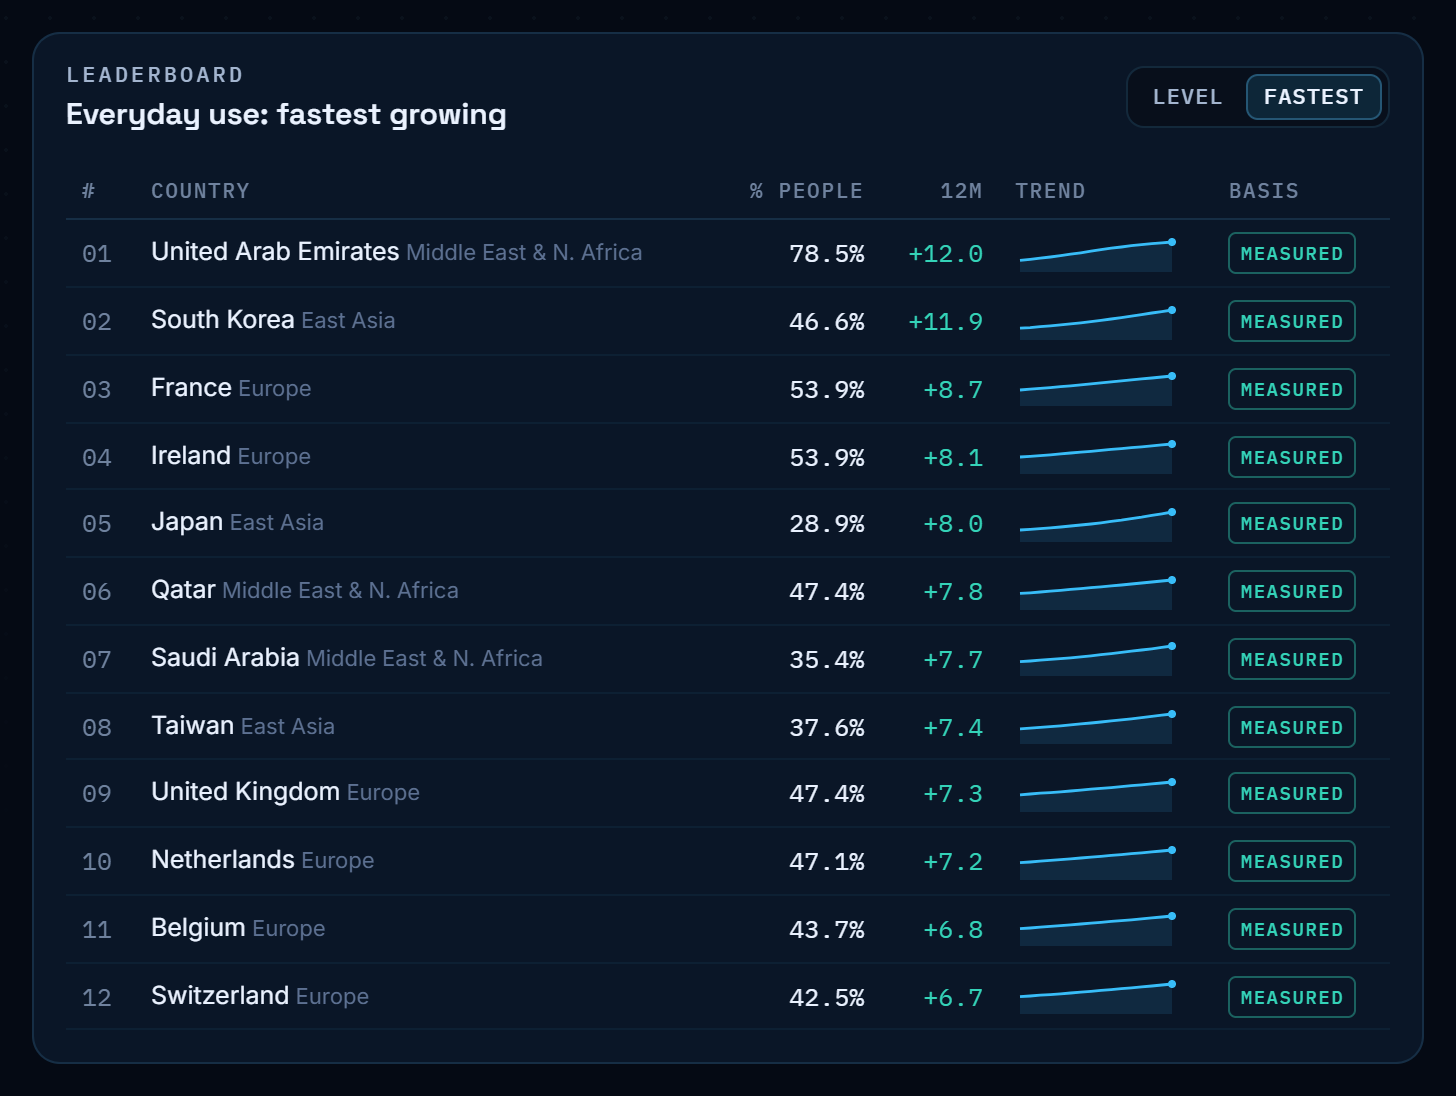
Over the last twelve months the UAE and South Korea each added about 12 points of everyday use. France (+8.7), Ireland (+8.1) and Japan (+8.0) follow. Japan is the one to watch: it starts from a lower base, 28.9%, and is climbing faster than most of Europe.
4. Business use has a different leaderboard
The share of people using AI and the share of firms using it are separate stories. Denmark leads business use at about 54% of firms (Eurostat measured 42% for 2025, and the atlas nowcasts forward). South Korea (53%), Finland (50%), Sweden, Belgium, Singapore and the Netherlands follow, with Israel 8th at 45%.
In Denmark, South Korea, Finland, India and Saudi Arabia, the share of firms using AI is already higher than the share of people. That is what it looks like when companies move AI from personal experiments into company processes.
The official numbers behind it: 20% of EU enterprises with 10 or more employees used AI in 2025 (Eurostat), 38% of UK firms with 10 or more employees in September 2026 (ONS), and 24.6% of all US employer firms in a two-week period in October 2026 (US Census Bureau).
5. Builders cluster where developers are dense
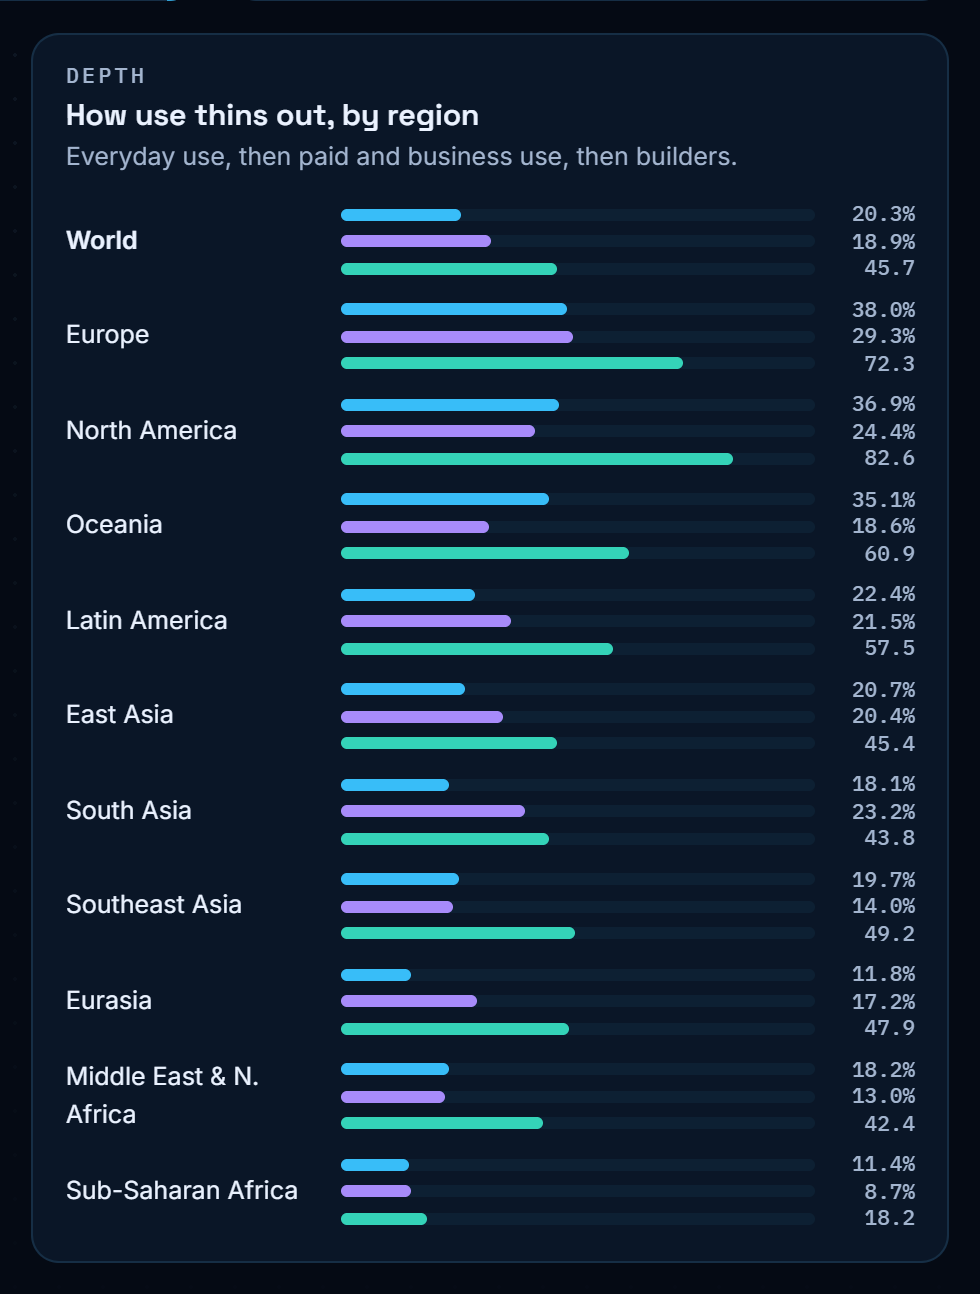
The builder index combines developer activity on GitHub, downloads of AI agent frameworks, the share of AI use that goes to coding, and the share of developers who use AI agents. Hong Kong and Singapore lead (97.5), then Estonia (89.1), Israel (87.8), Latvia, the Netherlands, Australia and Canada. The United States is 12th.
Israel shows how differently the levels can move inside one country: 4th in the world on the builder index, 8th in business use, 16th in everyday use (about 41% of working-age people; Microsoft measured 38.7% in Q2 2026), and 7th on the overall adoption index. The country builds with AI faster than its general population adopts it.
6. The gap between regions is widening
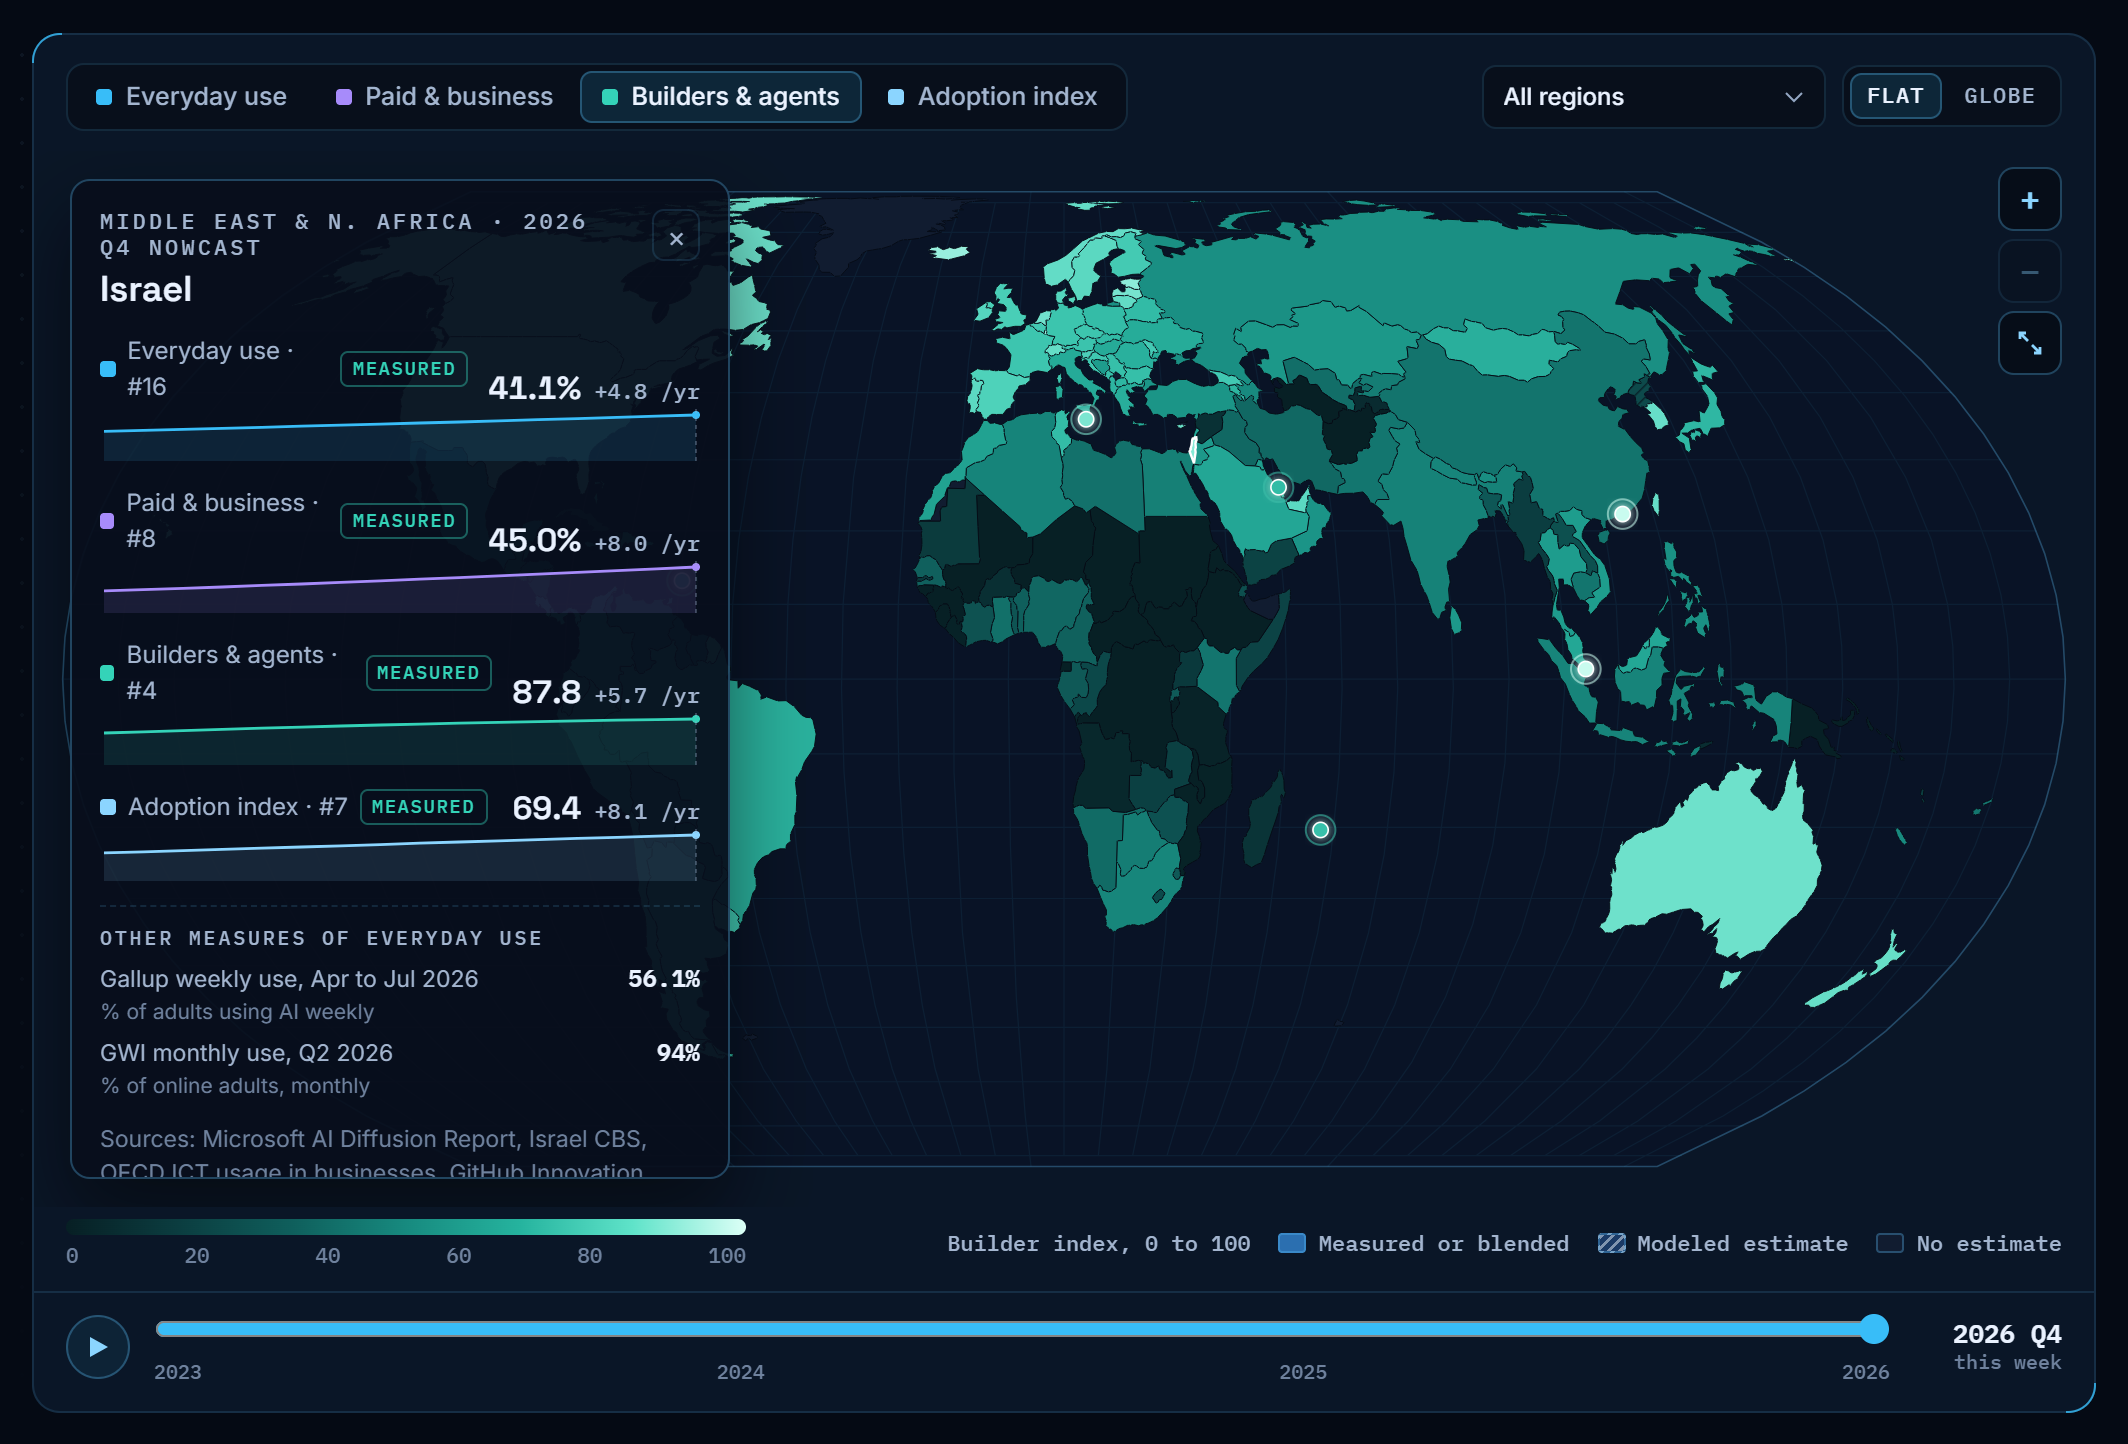
Per quarter, North America adds 1.63 points of everyday use and Europe 1.44. Sub-Saharan Africa adds 0.50, Eurasia 0.61 and East Asia 0.75. At these speeds, the regions that lead today pull further ahead every quarter.
The builder layer moves on its own map. It is accelerating fastest in South Asia (+1.76 index points a quarter), the Middle East and North Africa (+1.72), Latin America (+1.68) and Southeast Asia (+1.64), all faster than North America (+1.22). The next wave of AI builders is growing outside the regions that lead everyday use.
One caveat: China is the largest open question. Microsoft's telemetry measured 17.5% in Q2 2026, while China's CNNIC counts 43% of the population as AI users and Gallup found 62% using AI weekly. The atlas uses Microsoft's figure for consistency across countries and shows the others in China's panel.
7. Money is moving far faster than people
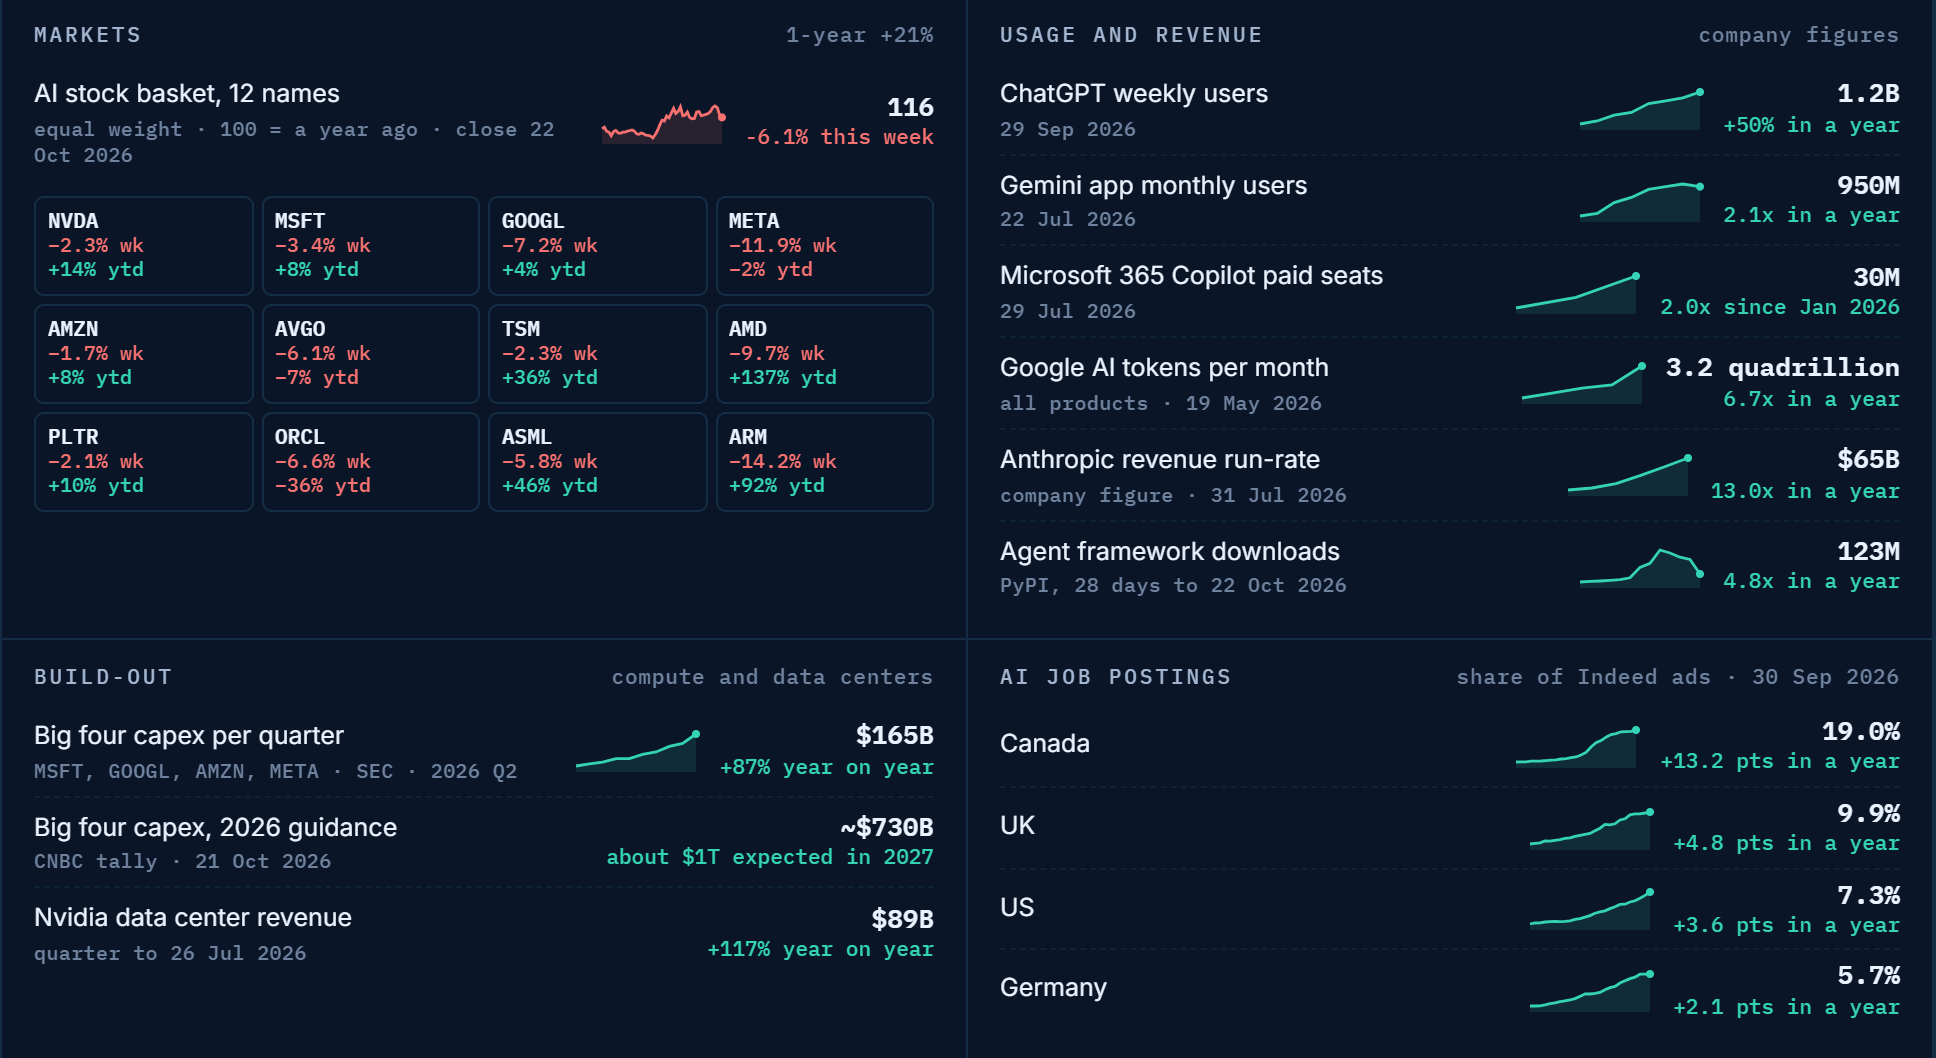
This is the clearest signal in the data. AI took 64% of all venture funding in the third quarter of 2026, $102 billion of $159 billion (Crunchbase), and AI venture funding is up 127% on a year earlier. Microsoft, Alphabet, Amazon and Meta spent $165 billion on capital expenditure in a single quarter, up 87% in a year, and are on track for about $730 billion in 2026.
Usage volume grows at a similar pace. ChatGPT reached 1.2 billion weekly users (+50% in a year). Google processes 3.2 quadrillion AI tokens a month, 6.7 times a year earlier. Microsoft 365 Copilot paid seats doubled to 30 million between January and July. Downloads of AI agent frameworks reached 123 million in 28 days, 4.8 times the level a year ago.
Compare that with the share of people using AI, which rose 3.6 points in twelve months. Capacity is being built far ahead of adoption. That keeps pushing prices down and capabilities up, and for most organizations the limit becomes how fast people and processes can absorb the tools.
What this means for a small or mid-size business
Three practical conclusions from the data:
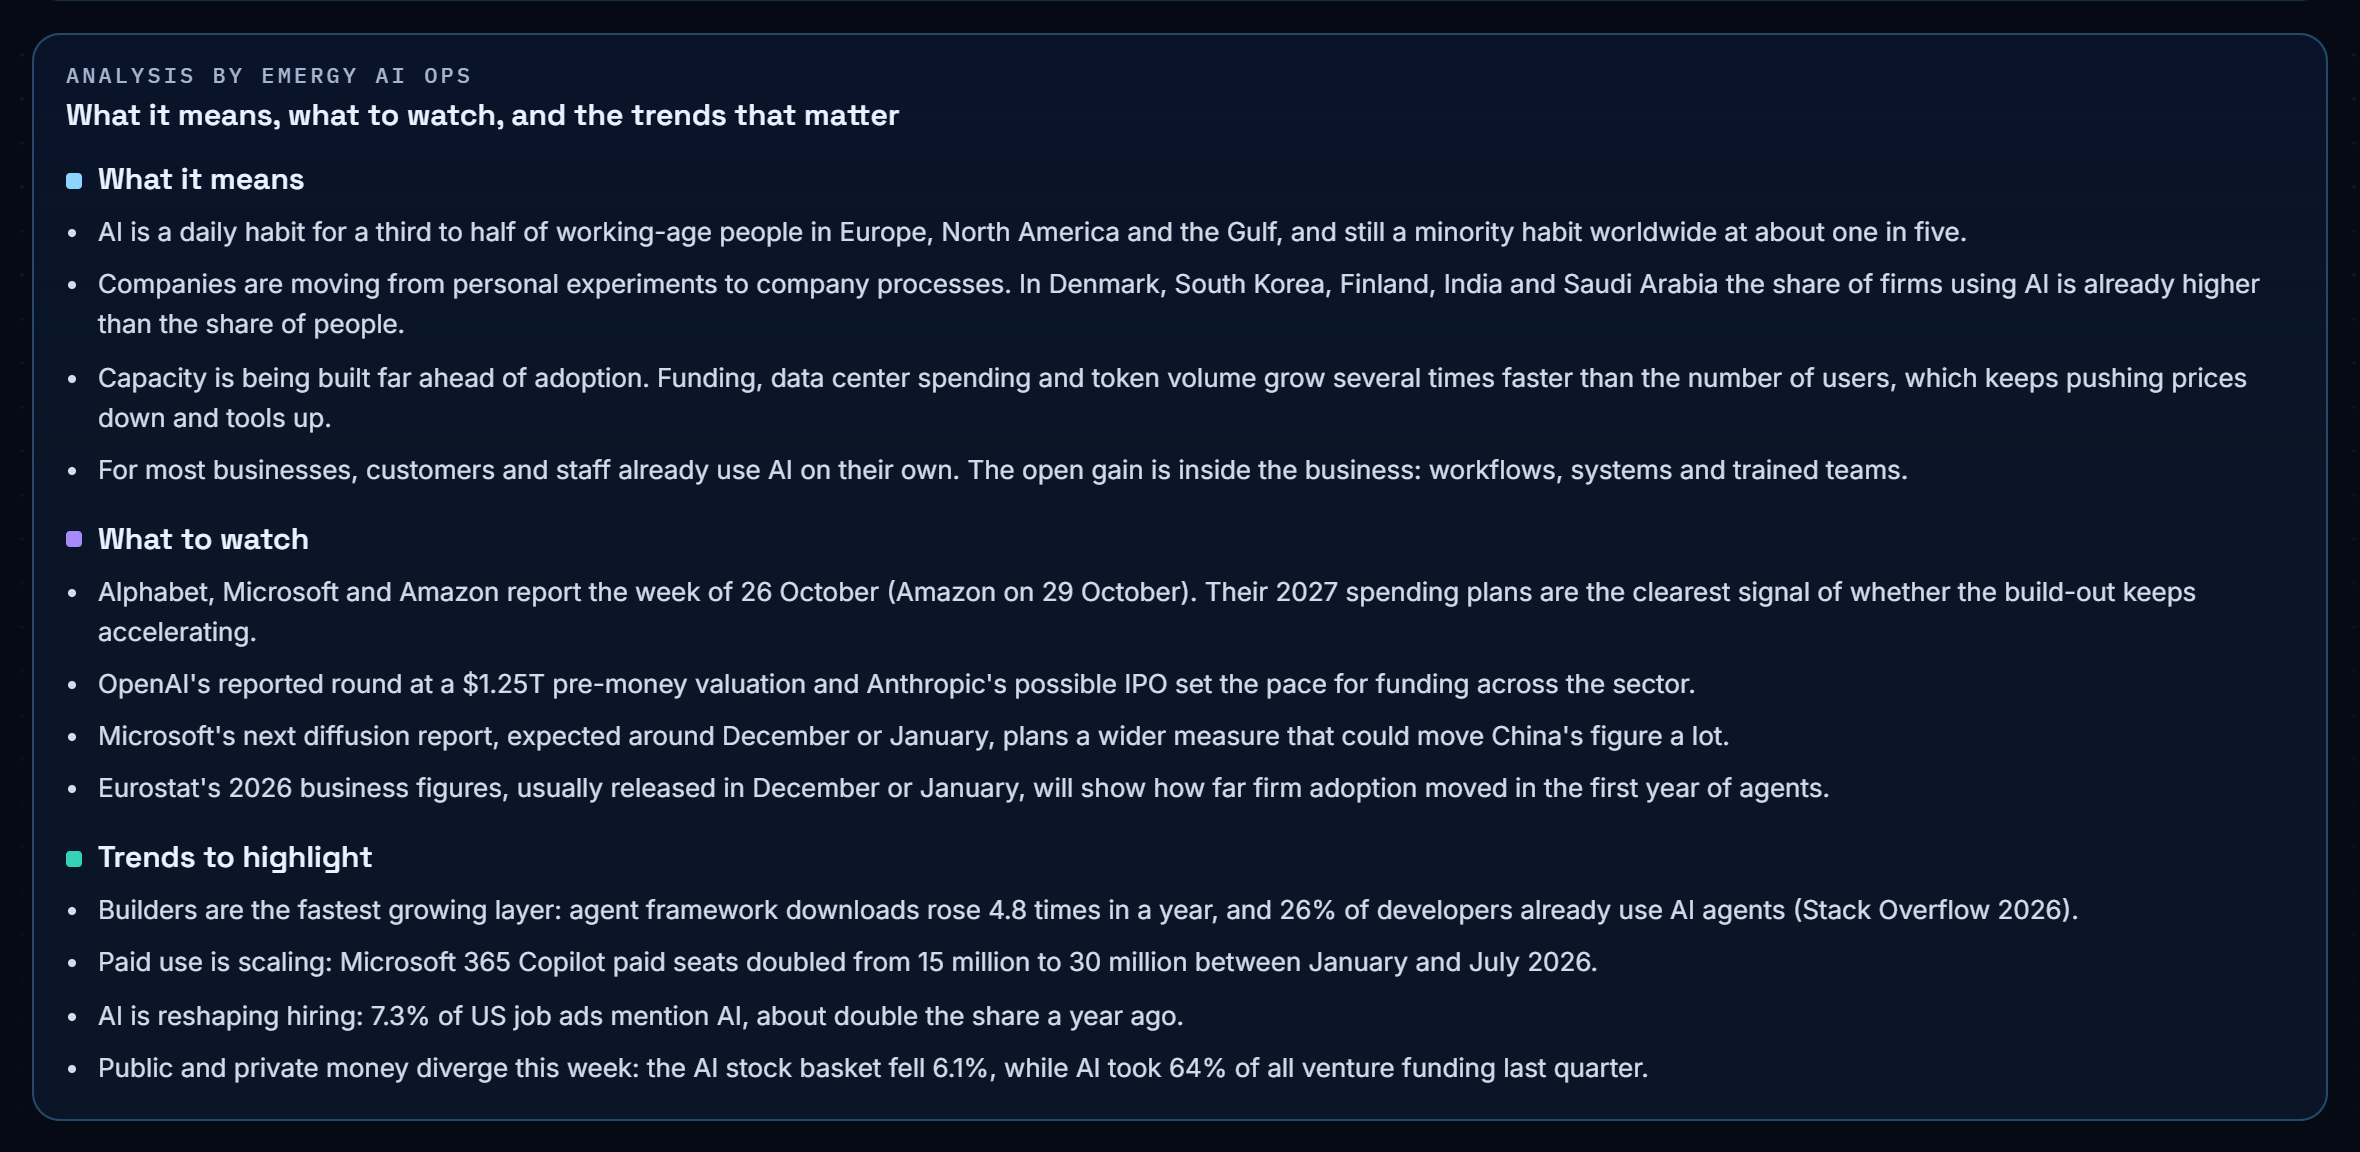
- Your customers and your staff already use AI. In most of Europe, North America and the Gulf, a third to half of working-age people use AI tools on their own. Their expectations for response time, personalization and self-service move with them.
- The open gain is inside the business. Business adoption grows about 1.2 points a quarter worldwide, and in most countries fewer than half of firms use AI at all. A small company that puts AI into one real workflow this quarter is still early in almost every market on the map.
- The tools will keep getting cheaper and better. With capital and capacity growing several times faster than users, the hard part for most businesses is choosing the right process, preparing the data it runs on, and training the team that uses it.
A simple way to start
- Pick one repeating task with clear rules and a person who approves the result. The guide how to choose the first workflow to automate with AI walks through it.
- Estimate the full cost before you buy: the tools, the work of connecting them, and the team's time. See what drives the cost of an AI implementation.
- Train the team on its own work. Training holds when people practice on their own tasks and documents, with someone to ask in the first weeks. More on AI training for teams.
What to watch next
- Alphabet, Microsoft and Amazon report earnings the week of 26 October (Amazon on 29 October). Their 2027 spending plans will show whether the build-out keeps accelerating.
- Microsoft's next AI Diffusion Report, expected around December or January, plans a wider measure that could move China's figure a lot.
- Eurostat's 2026 business figures, usually out in December or January, will show how far firm adoption moved in the first year of AI agents.
The atlas analysis is rewritten every week as these numbers land, and the map updates every Saturday night.
How the atlas works
The atlas combines about 25 sources: Microsoft's AI Diffusion Report, the Anthropic Economic Index, Gallup, Eurostat, the UK's ONS, the US Census Bureau, national statistics offices including Israel's CBS, GitHub's Innovation Graph, PyPI download data and the Stack Overflow Developer Survey, plus company figures for funding, usage and spending.
Each week it collects new data, calibrates proxies against official measurements where both exist, fills countries without measurements from internet use, income and region (drawn hatched on the map), and nowcasts each country forward from its last official number. Every figure links to its source in the method table, and the country data is open to browse.
Frequently asked questions
Which country uses AI the most in 2026?
The United Arab Emirates, with about 79% of working-age people using AI tools, followed by Singapore (67%) and France and Ireland (about 54%).
Where does the United States rank in AI adoption?
24th in everyday use (36.4% of working-age people), 33rd in business use and 12th on the builder index.
How many people use AI worldwide?
About one in five working-age people: 18.8% in Q2 2026 according to Microsoft, and an atlas nowcast of 20.3% for Q4 2026.
How does Israel rank in AI adoption?
4th in the world on the builder index, 8th in business use, 16th in everyday use and 7th on the overall adoption index.
Which region is adopting AI fastest?
North America (+1.63 points a quarter) and Europe (+1.44) for everyday use; South Asia (+1.76) and the Middle East and North Africa (+1.72) for builders.